Visualisation
mlipx uses ZnDraw as primary tool for visualisation and comparison.
The following will give you an overview.
The ZnDraw package provides versatile visualisation package for atomisitc structures. It is based on ASE and runs as a web application. You can install it via:
pip install zndraw
It can be used to visualize data through a CLI:
zndraw file.xyz # any ASE supported file format + H5MD
zndraw --remote . Node.frames # any ZnTrack node that has an attribute `list[ase.Atoms]`
Once you have a running ZnDraw instance, you can connect to it from within Python.
You can find more information in the GUI by clicking on Python Access.
The vis object behaves like a list of ASE atom objects.
Modifying them in place, will be reflected in real-time on the GUI.
Tip
You can keep a ZnDraw instance running in the background and set the environment variable ZNDRAW_URL to the URL of the running instance.
This way, you do not have to define a ZnDraw url when running ZnDraw or mlipx CLI commands.
You can also setup a ZnDraw Docker container to always have a running instance.
from zndraw import ZnDraw

vis = ZnDraw(url="http://localhost:1234", token="<some-token>")

print(vis[0])
>>> ase.Atoms(...)

vis.append(ase.Atoms(...))
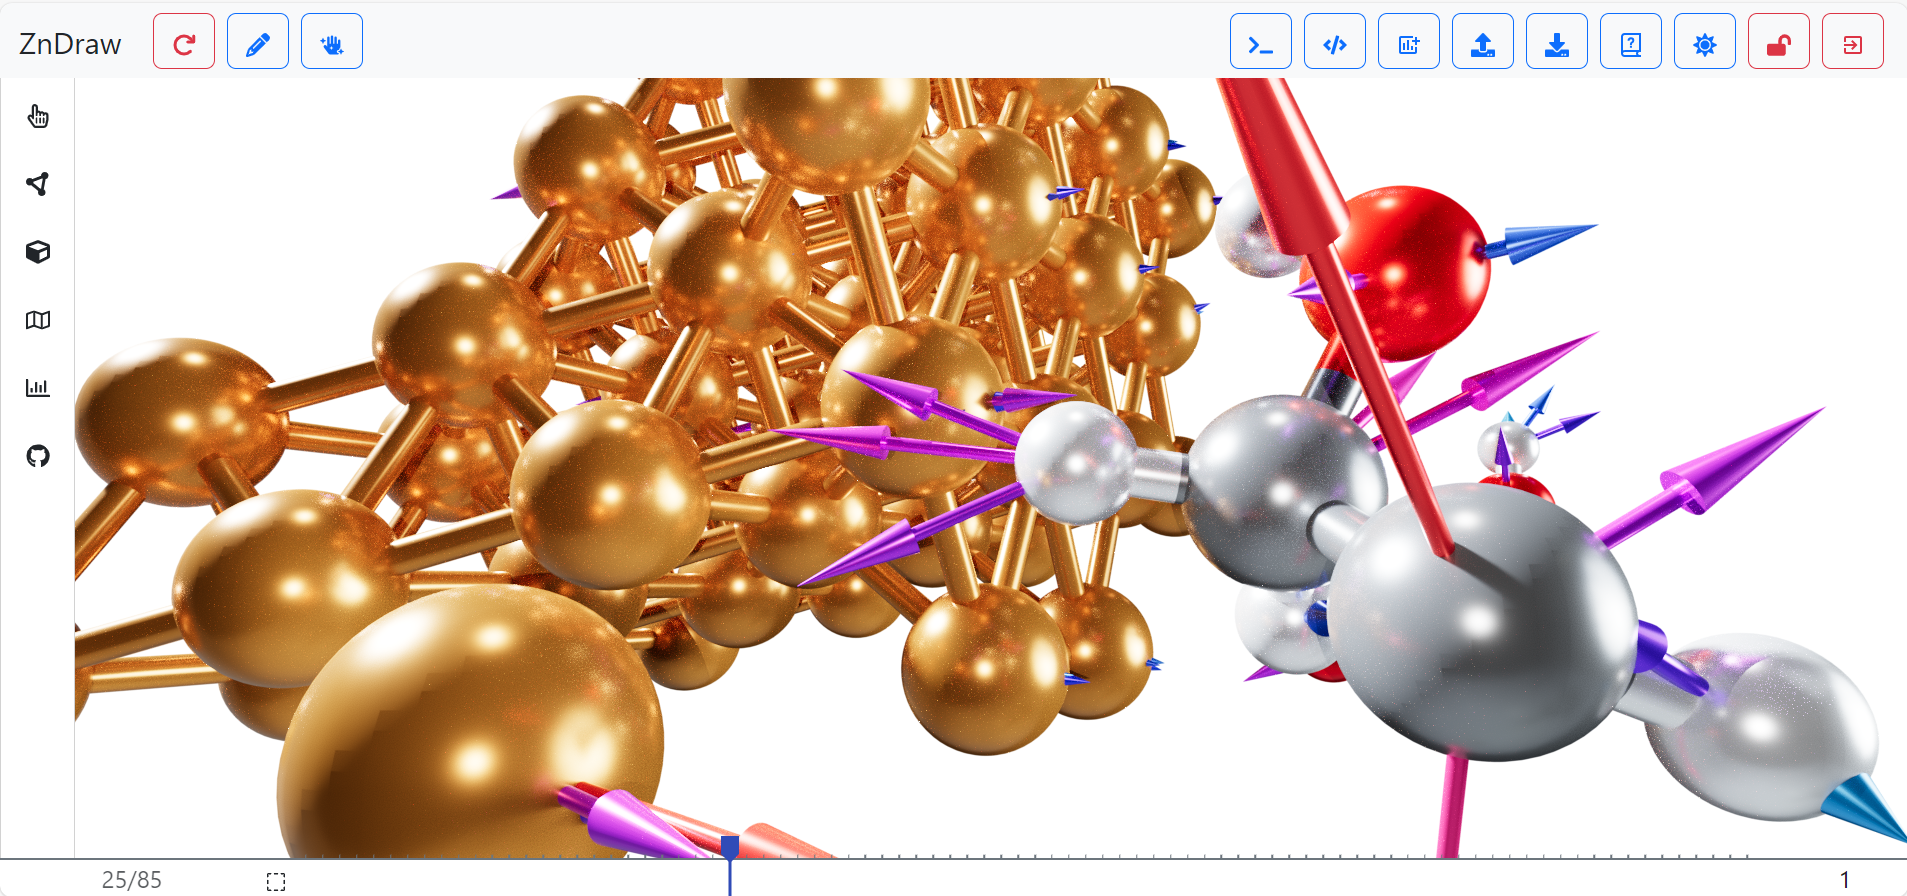
Figure 1 Graphical user interface of the ZnDraw package with GPU path tracing enabled.
For further information have a look at the ZnDraw repository https://github.com/zincware/zndraw - a full documentation will be provided soon.